Showing posts with label Excel. Show all posts

Friday, November 23, 2018

Synthetic Basis Spread Calculation for Short-term Cross-currency Swaps

For cross-currency basis spread curves, there are usually no quotes available below 1Y time point (for 3M and 6M) and there might be a need to implement the appropriate calculation methodology for the missing data. This post will explain one possible calculation methodology based on Covered Interest Parity and presents the most relevant test results for this applied methodology.

Methodology


We will use adjusted version of traditional Covered Interest Rate Parity (CIP) for calculating synthetic quotes for short-term cross-currency basis spreads. First, in the absence of any arbitrage opportunities, CIP is assuming that the following parity will hold:


Assuming EUR/USD currency pair, we may consider the following two separate investment strategies:

1. Converting EUR amount to USD by using FX spot rate, then investing received USD amount by using USD interest rate for a given period and finally, converting resulting USD amount back to EUR by using FX forward.

2. Investing directly into EUR currency by using EUR interest rate for a given period.

As empirical evidence is strongly suggesting, CIP does not hold, since there is always some basis spread for a given currency pair for a given period. In order to take this basis spread properly into account, adjusted CIP is assuming the following parity to hold:


Where S is cross-currency basis spread for a given period. Finally, we can solve this cross-currency basis spread S for a given period by using the following analytical formula:


Test I: snapshot


As a first test for evaluating this methodology, we used formula for calculating short-term basis spread for a few liquid/major currency pairs. We used comparison data for this specific date from Bloomberg and/or ICE. We present the results in the following tables. Note, that even the curves are up to 5Y, only 3M and 6M points have been estimated by using Adjusted CIP.


For these specific liquid/major currency pairs, applied calculation methodology is able to re-produce snapshot market quotes for the short-end relatively accurately. General hypothesis is, that the more liquid/major the currency pair, the more accurate results will be produced by Adjusted CIP.

Test II: time-series


At this point in our analysis, we are interested about the consistency of the proposed methodology. We want to know, whether this methodology produces consistent results as market changes over time. As a second test, we calculated short-term basis spread time-series for EUR/USD pair since the beginning of the year of 2014. We have used Bloomberg market quotes for this period as benchmark. The following table shows time-series data for 3M cross-currency basis spread.


While there are clearly some periods with larger difference between market quote and estimated spread, applied calculation methodology is still able to re-produce market quotes consistently and relatively accurately over time.

Sensitivity


Generally, calculated basis spread estimate is highly sensitive for the interaction of specific variables (∆t, FX spot and FX forward). More specifically, as tenor ∆t will approach to zero, the relative change in spread estimate will generally increase. The following analysis was made for EUR/USD currency pair. All the other parameters were held constant, while FX spot was stressed to both directions in order to see the effect. In practice this means, that basis spread estimate might be heavily biased if, for example, market variables used in parity formula are not captured exactly at the same time.


Practical implementation notes


Assume the following parameters and market data. As we estimate spread for 3M tenor, we can use adjusted CIP formula as follows:


Note, that when estimating spread for 6M tenor, the formula above can still be used, but domestic and foreign interest rate quotes must be adjusted accordingly by using 3v6 tenor basis spreads. Since there is no explicit basis spread quotes available for 3M and 6M, 1Y quote can be used as relatively close proxy.


Finally, the following Excel/VBA function implements the calculation presented above. Thanks for reading my blog.
-Mike

Public Function GetXCCYBasisSpread( _
    ByVal FX_spot As Double, _
    ByVal FX_forward As Double, _
    ByVal BaseDepositRate As Double, _
    ByVal TermDepositRate As Double, _
    ByVal Tenor As String, _
    ByVal BasisSign As Integer, _
    ByVal ScaleRates As Boolean, _
    ByVal UseForwardPoints As Boolean, _
    ByVal ConvertToBasisPoints As Boolean) As Double
    
    ' tenor conversion from string ("3M") to double (0.25)
    ' handling for FX spot and forward, rate scaling
    Dim tenorInYears As Double
    If (VBA.UCase(Tenor) = "3M") Then tenorInYears = (3 / 12)
    If (VBA.UCase(Tenor) = "6M") Then tenorInYears = (6 / 12)
    If (UseForwardPoints) Then FX_forward = FX_spot + FX_forward
    If (ScaleRates) Then
        BaseDepositRate = BaseDepositRate / VBA.CDbl(100)
        TermDepositRate = TermDepositRate / VBA.CDbl(100)
    End If

    ' calculate cross-currency basis spread from given market data
    ' by using modified FX-IR-parity :
    ' (FX_spot / FX_forward) * (1 + R_domestic * dt) = (1 + [R_foreign + spread] * dt)
    
    ' solve the previous parity formula for spread
    Dim spread As Double
    spread = (((FX_spot / FX_forward) * (1 + TermDepositRate * tenorInYears) - 1) * _
            (1 / tenorInYears)) - BaseDepositRate
    
    If (ConvertToBasisPoints) Then spread = spread * 10000
    GetXCCYBasisSpread = spread * VBA.CDbl(BasisSign)
End Function

Sunday, July 23, 2017

Excel/VBA : Publishing HTML Reports from Excel


In my opinion, creating reports directly from Excel workbook is a bit old-fashioned way to handle the case. For any official reporting (meant to be published for a wide audience of stakeholders, needs to have traceable history), my recommendation is pretty much the following : process calculations (say, by using third-party software), process results into SQL server database (to store report history), create views using relevant database tables, finally use SSRS by linking report graphical objects with database views for report publishing.

However, there might still be some cases, in which this kind of processing would definitely be considered as overkill. Say, a batch of processed daily calculation results must be shared within the unit for some internal (informal) checking. For such cases, creating report directly from Excel workbook by using publishObject in VBA is quite handy and inexpensive solution. So, what to do then ? First, create a report page (one centralized worksheet) from which all the reports (there can be more than just one report to be published) will be published. For each report, define a named range which covers the exact area to be published. As an example, the screenshot below shows imaginary Excel report what I have created. Note, that the actual file name for HTML file has been defined as a comment property of Excel.Name object. Note also, that the figures in table below are arbitrary.


Next, I have defined a network folder (hard-coded in the program) into which this report will be published as html page. Finally, I have implemented the program (presented below) in Excel, from which the report (or several reports) will be published. As a user will press command button (create reports), the program will create html file, as shown in the screenshot below.


VBA program for handling command button "click" event is presented below.

Option Explicit
'
Private Const folderPathNameForHTMLFiles As String = "C:\temp\HTMLReporting\"
'
Private Sub btnCreateReports_Click()
    '
    ' deactivate command button pressing
    ActiveSheet.Range("A1").Select
    '
    Dim reportRangeName As Excel.Name
    Dim reportRange As Excel.Range
    Dim report As PublishObject
    Dim reports As PublishObjects: Set reports = ActiveWorkbook.PublishObjects
    '
    ' loop through all names within active workbook
    For Each reportRangeName In ActiveWorkbook.Names
        '
        ' preparation for the case, in which the name is corrupted
        On Error GoTo exitPoint
        ' handle only the names related to ranges in reporting worksheet
        If (reportRangeName.RefersToRange.Worksheet.Name = ActiveSheet.Name) Then
            '
            ' disable screen updating
            Excel.Application.ScreenUpdating = False
            ' create Excel range for report
            Set reportRange = Worksheets(ActiveSheet.Name).Range(reportRangeName.Name)
            reportRange.Select
            '
            ' create path and name for HTML report file
            ' file name (including html extension) is defined as comment within Excel name
            Dim HTMLFilePathName As String
            HTMLFilePathName = folderPathNameForHTMLFiles + reportRangeName.Comment
            '
            ' create and publish report as publishedObject object
            Set report = reports.Add( _
                SourceType:=xlSourceRange, _
                fileName:=HTMLFilePathName, _
                Sheet:=reportRange.Worksheet.Name, _
                Source:=reportRange.Address, _
                HtmlType:=xlHtmlStatic)
            report.Publish True
        End If
        '
exitPoint:
    Next
    '
    ' finally, delete all reports from active workbook
    reports.Delete
    Range("A1").Select
    Excel.Application.ScreenUpdating = True
End Sub
'

Finally, thanks a lot for reading this blog.
-Mike

Friday, June 9, 2017

Excel/VBA : Multi-threading example

Let us face the fact : there is no multi-threading possibilities for VBA. However, if you have any VBA program in your Excel workbook, create multiple copies of that workbook and finally start that VBA program within each of the copied workbook, you got multiple Excel workbooks (VBA programs) running simultaneously. By definition, that is multi-threading.

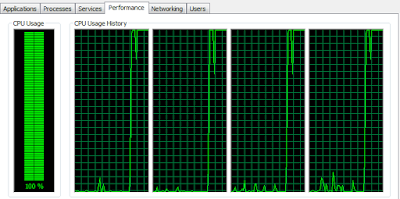
One may ask with very good reason why even bother, since we already have easy-to-use multi-threading libraries available for more sophisticated languages ? Sometimes you may not have any other choice. A few years ago I started to work with one "state-of-the-art" analytics library for processing some extremely time-consuming calculations. By that time, all calculations were supposed to be processed in Excel and we did not have any access to real development API. Very fortunately, I discovered a collection of relevant VBA interface functions available for that library. Despite of this amazing discovery, processing calculations in VBA was still annoyingly slow. Finally I decided to test the scheme described above. I created multiple copies of one master workbook (which was having a relevant program for processing required calculations), opened multiple Excel workbooks and finally started a program within each workbook (almost) simultaneously. This was truly a "poor man's multi-threading", but despite of that it really did the job well. Example program in this post is taking this described scheme a bit further, as it completely removes the burden of administrating required Excel workbooks.

The main idea for this program is to create desired amount of active workbook copies (which has a relevant program for processing required calculations) into a folder. Moreover, for each of the workbook copy, corresponding VB script file will be created for starting required VBA program within Excel workbook copy. VB script is also taking care of all relevant administrative responsibilities (cleaning all Excel workbooks and VB script files from folder after program execution). Calculation results from different Excel threads will be printed into a shared text file. It should be noted, that SomeComplexAlgorithm procedure is an entry point for Excel thread (started by VB script). For brevity reasons, the content of this example program has been left to be trivial (simulate random number between one and ten for delay time execution and finally store that number into a collection).

Insert a new VBA module and copy-paste the following program.

Option Explicit
'
' common text file for results from all Excel threads
Private Const resultsFilePathName As String = "C:\Users\Administrator\Desktop\ExcelThreading\shared.txt"
'
Public Sub CreateExcelThreads()
    '
    ' clean results text file
    Dim fileSystem As New Scripting.FileSystemObject
    fileSystem.CreateTextFile resultsFilePathName, True
    Set fileSystem = Nothing
    '
    ' create (and execute) Excel workbook threads
    Dim ExcelThreadsFolderPathName As String: ExcelThreadsFolderPathName = "C:\Users\Administrator\Desktop\ExcelThreading\"
    Dim numberOfExcelThreads As Integer: numberOfExcelThreads = 4
    Dim ExcelThreadName As String
    Dim i As Integer
    '
    For i = 1 To numberOfExcelThreads
        ExcelThreadName = "ExcelThread_" + VBA.CStr(i)
        ExecuteExcelThread "SomeComplexAlgorithm", ExcelThreadName, ExcelThreadsFolderPathName
    Next i
End Sub
'
Public Function ExecuteExcelThread(ByVal TargetProgram As String, ByVal ExcelThreadName As String, ByVal ExcelThreadsPathName As String)
    '
    ' save a copy of current active workbook
    Dim ExcelThreadFilePathName As String: ExcelThreadFilePathName = ExcelThreadsPathName + ExcelThreadName + ".xlsm"
    TargetProgram = ExcelThreadName + ".xlsm!" + TargetProgram
    Dim VBScriptFilePathName As String: VBScriptFilePathName = ExcelThreadsPathName + ExcelThreadName + ".vbs"
    ActiveWorkbook.SaveCopyAs ExcelThreadFilePathName
    '
    ' create commands for VB script file
    Dim fileSystem As New Scripting.FileSystemObject
    Dim writer As Scripting.TextStream
    Set writer = fileSystem.OpenTextFile(VBScriptFilePathName, ForWriting, True)
    ' re-open previously saved Excel workbook
    writer.WriteLine "Set ExcelApplication = CreateObject(""Excel.Application"")"
    writer.WriteLine "Set ExcelWorkbook = ExcelApplication.Workbooks.Open(""" + ExcelThreadFilePathName + """)"
    writer.WriteLine "ExcelApplication.Visible = False"
    ' run target VBA program and close Excel workbook
    writer.WriteLine "ExcelWorkbook.Application.Run """ + TargetProgram + """"
    writer.WriteLine "ExcelApplication.ActiveWorkbook.Close True"
    writer.WriteLine "ExcelApplication.Application.Quit"
    ' delete copies of Excel workbook and VB script
    writer.WriteLine "Set fileSystem = CreateObject(""Scripting.FileSystemObject"")"
    writer.WriteLine "fileSystem.DeleteFile """ + ExcelThreadFilePathName + """"
    writer.WriteLine "fileSystem.DeleteFile """ + VBScriptFilePathName + """"
    writer.Close
    Set writer = Nothing
    Set fileSystem = Nothing
    '
    ' execute VB script
    Dim scriptingShell As Object: Set scriptingShell = VBA.CreateObject("WScript.Shell")
    scriptingShell.Run VBScriptFilePathName
    Set scriptingShell = Nothing
End Function
'
Public Sub SomeComplexAlgorithm()
    '
    ' this is target program to be executed by Excel thread
    ' program creates N random numbers between 1 and 10, stores these into
    ' collection and finally prints the content into a specific text file
    Dim simulationResult As New Collection
    Dim i As Integer
    For i = 1 To 25
        ' due to brevity reasons, we just simulate some time-consuming algorithm
        Dim delayTime As Long: delayTime = WorksheetFunction.RandBetween(1, 10)
        Sleep delayTime
        ' store one simulated result (random delay time) into collection
        simulationResult.Add delayTime
    Next i
    '
    ' print result collection into a specific text file
    ' we have to be prepared for the case in which multiple users (Excel threads)
    ' are accessing the same specific text file at the same time
recoveryPoint:
    On Error GoTo errorHandler
    Dim fileSystem As New Scripting.FileSystemObject
    Dim writer As Scripting.TextStream
    '
    ' if the file is in use, error will be thrown below here
    Set writer = fileSystem.OpenTextFile(resultsFilePathName, ForAppending, False)
    For i = 1 To simulationResult.Count
        writer.WriteLine ActiveWorkbook.Name + "=" + VBA.CStr(simulationResult(i))
    Next i
    writer.Close
    Set simulationResult = Nothing
    Set writer = Nothing
    Set fileSystem = Nothing
    Exit Sub
    '
errorHandler:
    ' get one second delay and re-access text file
    Sleep 1
    Resume recoveryPoint
End Sub
'
Public Function Sleep(ByVal seconds As Long)
    '
    Dim startTime As Long: startTime = VBA.Timer
    Do
        If (VBA.Timer >= (startTime + seconds)) Then Exit Do
    Loop
End Function
'

Simulating 100 random numbers (setting delay time to 1) using just one Excel thread : processing time 0:01:50.


Simulating 100 random numbers (setting delay time to 1) using four Excel threads (25 numbers for each thread) : processing time 0:00:30, which turns out to be almost quadruple time improvement in comparison with single-threaded processing.


Finally, thanks for reading this blog.
-Mike

Monday, December 26, 2016

XLW : Interfacing C++11 PathGenerator to Excel

In my previous post on generating paths for different types of one-factor processes, I was writing all processed paths sequentially into separate CSV files. Later, these files could be opened in Excel for any further use. This approach is far from being an efficient way to interface C++ program to Excel. While being possible to create in-house tool for this task, the actual implementation part requires relatively deep understanding and hands-on experience on Excel/C API. The amount of issues to be learned in order to produce truly generic and reliable tool, is far from being something which could be internalized in very short period of time. There are limited amount of books available on this topic, but the most recommended book is the one written by Steve Dalton.

This time, I wanted to present kind of "industry standard" way to accomplish this task using "easy-to-use" Excel/C++ interfacing tool, which has been there already since 2002. XLW is an application which wraps Excel/C API into a simple C++ interface, which can then be used to customize Excel with user-defined worksheet functions. For any newcomer into this issue, it is highly recommended first to watch instructional "how-to-use" clips from project homepage. The complete workflow of using XLW wrapper is presented there from downloading to debugging. Also, AdaptiveRisk blog is presenting extremely useful stuff, well enough to get started.


cppinterface.h


For this project, I have extracted a new XLW xll template and opened corresponding solution in my Visual Studio Express 2013. The content of this header file in my current project is presented below. I have method declarations for two functions, which are both returning matrix object (XLW data structure). It is my intention to use my previous PathGenerator project, in order to fill these matrix objects with paths using desired one-factor processes.

#ifndef TEST_H
#define TEST_H
//
#include "xlw/MyContainers.h"
#include <xlw/CellMatrix.h>
#include <xlw/DoubleOrNothing.h>
#include <xlw/ArgList.h>
#include <xlw/XlfServices.h>
//
using namespace xlw;
//
//<xlw:libraryname=XLWPathGenerator
//
// method for requesting vasicek paths
MyMatrix // return matrix of random paths following Vasicek SDE
//<xlw:volatile
GetPaths_Vasicek(double t, // time to maturity
double r, // current short rate
double longTermRate, // long-term average rate
double meanReversion, // mean reversion speed
double rateVolatility // rate volatility
);
//
// method for requesting GBM paths
MyMatrix // return matrix of random paths following Geometric Brownian Motion SDE
//<xlw:volatile
GetPaths_BrownianMotion(double t, // time to maturity
double s, // current spot rate
double rate, // risk-free rate
double volatility // volatility
);
//
#endif

Commenting may seem a bit strange first, but the following screenshot containing Excel function argument input box may help to catch the point.


source.cpp


Implementations for two methods declared in header file are presented below. Information concerning number of time steps (for a path) and number of paths to be created are extracted from matrix dimensions using XlfServices object. After this, desired OneFactorProcess and PathGenerator objects are created. Finally, PathGenerator object is used to process a path, which will be imported into resulting matrix object (paths) and returned for the client (Excel).

#include <cppinterface.h>
#include "PathGenerator.h"
#pragma warning (disable : 4996)
//
MyMatrix GetPaths_Vasicek(double t, double r, double longTermRate, double meanReversion, double rateVolatility)
{
 // request dimensions for calling matrix
 const unsigned int nPaths = XlfServices.Information.GetCallingCell().columns();
 const unsigned int nSteps = XlfServices.Information.GetCallingCell().rows();
 // create container for all processed paths
 MyMatrix paths(nSteps, nPaths);
 // create container for a single path to be processed
 MyArray path(nSteps);
 //
 // create vasicek process and path generator
 std::shared_ptr<MJProcess::OneFactorProcess> vasicek =
  std::shared_ptr<MJProcess::Vasicek>(new MJProcess::Vasicek(meanReversion, longTermRate, rateVolatility));
 PathGenerator<> shortRateProcess(r, t, vasicek);
 //
 // process paths using path generator
 for (unsigned int i = 0; i != nPaths; ++i)
 {
  shortRateProcess(path);
  // import processed path into paths container
  for (unsigned j = 0; j != nSteps; ++j)
  {
   paths[j][i] = path[j];
  }
 }
 return paths;
}
//
MyMatrix GetPaths_BrownianMotion(double t, double s, double rate, double volatility)
{
 // request dimensions for calling matrix
 const unsigned int nPaths = XlfServices.Information.GetCallingCell().columns();
 const unsigned int nSteps = XlfServices.Information.GetCallingCell().rows();
 // create container for all processed paths
 MyMatrix paths(nSteps, nPaths);
 // create container for a single path to be processed
 MyArray path(nSteps);
 //
 // create geometric brownian motion process and path generator
 std::shared_ptr<MJProcess::OneFactorProcess> brownianMotion =
  std::shared_ptr<MJProcess::GBM>(new MJProcess::GBM(rate, volatility));
 PathGenerator<> equityPriceProcess(s, t, brownianMotion);
 //
 // process paths using path generator
 for (unsigned int i = 0; i != nPaths; ++i)
 {
  equityPriceProcess(path);
  // import processed path into paths container
  for (unsigned j = 0; j != nSteps; ++j)
  {
   paths[j][i] = path[j];
  }
 }
 return paths;
}
//


In order to get this thing up and running, header file for PathGenerator has to be included. I have set the current XLL project as startup project. As a side, I have opened my PathGenerator project (containing header files for RandomGenerator, OneFactorProcess and PathGenerator). Since this side project is still unaccessible, it has to be linked to my current XLL project : Project - Properties - Configuration Properties - C/C++ - General - Additional Include Directories (Browse folder containing source files for the project to be linked). After completing these steps and building this project succesfully, I am finally ready to test the provided functionality in Excel.


Excel


After opening a new Excel, I need to drag-and-drop (or open from Excel) newly created xll template from my \\Projects\XLWTester\Debug folder to Excel. In my Excel (screenshot below), I have two boxes for input parameters (Vasicek, Brownian Motion) and two ranges for resulting one-factor process paths (36 steps, 15 paths). As soon as I hit F9 button, my one-factor paths will be re-created. Finally, it should be noted that the functions are both array formulas.


Finally, thanks for reading this blog. Pleasant waiting for a new year for everybody.
-Mike

Wednesday, May 18, 2016

Excel/VBA : Optimizing smooth Libor forward curve using Solver

In order to value fixed income derivatives cash flows, relevant forward rates and discount factors have to be defined from bootstrapped zero-coupon curve. In a Libor world, we use cash and FRA contracts (or futures contracts) in a short-end of the curve, while in a long-end of the curve we use relevant swap contracts. Let us assume for a moment, that we bootstrap zero-coupon curve, in order to define those forward rates and discount factors on a quarterly basis. While bootstrapping usually gives a smooth curve for a short-end of the curve, it will usually fail to do this for a long-end of the curve. This happens, because there is no relevant swap contracts available in a long-end of the curve and hereby, we need to do a lot of interpolation in a long-end of the curve for swaps. The resulting forward curve then looks like a chain of waterfalls.

This time, I wanted to present a cool way to solve those forward rates by using numerical optimization scheme. The topic itself has been thoroughly covered in chapter three in excellent book by Richard Flavell. In a nutshell, we first define the shortest end of the curve (using cash and forwards) and then we just guess the rest of the forward rates. After this, we minimize sum of squared differences between adjacent forward rates, subject to constraints. In this case, constraints are present values of swaps, which by definition will be zero. When this optimization task has been performed, the resulting forward curve will successfully re-price the current swap market.

In Excel worksheet, there has to be three named ranges to be used by VBA program:
  • Objective function (sum of squared differences between adjacent forward rates)
  • Constraints (swap PV for each swap contract used)
  • Decision variables (forward rates to be solved)

Screenshots below are showing required Excel worksheet setups along with optimized Libor forward curve, corresponding capture of Bloomberg smoothed forward curve and the actual VBA program needed to perform optimization task. Note, that for this example, I have been defining only the first 3-month Libor spot rate fixing. The rest of the forward rates are going to be solved. When setting up VBA program, remember to include references to Solver and Microsoft Scripting Runtime libraries.

Finally, thanks for reading my blog.
-Mike


' Worksheet : Libor
Option Explicit
'
Private Sub btnSolveLibor_Click()
    '
    ' define Excel ranges for objective function, decision variables and constraints
    Dim objectiveFunction As Range: Set objectiveFunction = Range("_objectiveFunction")
    Dim changingVariables As Range: Set changingVariables = Range("_changingVariables")
    Dim constraints As Range: Set constraints = Range("_constraints")
    '
    ' create parameter wrapper
    ' for objective function, decision variables and constraints, address of range is needed
    Dim parameters As New Scripting.Dictionary
    parameters.Add PRM.objectiveFunction, CStr(objectiveFunction.Address)
    parameters.Add PRM.changingVariables, CStr(changingVariables.Address)
    parameters.Add PRM.constraints, CStr(constraints.Address)
    parameters.Add PRM.maxMinVal, CInt(2) ' max=1, min=2, valueof=3
    parameters.Add PRM.userFinish, CBool(True)
    parameters.Add PRM.assumeNonNegative, CBool(False)
    parameters.Add PRM.relation, CInt(2) ' lessOrEqual=1, equal=2, greaterOrEqual=3
    parameters.Add PRM.formulaText, CStr("0.0")
    '
    ' create instance of constrained optimization model implementation
    Dim xlSolver As ISolver: Set xlSolver = New ConstrainedOptimization
    xlSolver.solve parameters
    '
    ' release objects
    Set xlSolver = Nothing
    Set parameters = Nothing
End Sub
'
'
'
'
'
' Module : Enumerators
Option Explicit
'
' enumerator needed for parameter wrapper
Public Enum PRM
    objectiveFunction = 1
    maxMinVal = 2
    valueOf = 3
    changingVariables = 4
    userFinish = 5
    assumeNonNegative = 6
    constraints = 7
    relation = 8
    formulaText = 9
End Enum
'
'
'
'
'
' Module : XLSFunctions
Option Explicit
'
Public Function GetSumOfSquaredDifferences(ByRef values As Excel.Range) As Double
    '
    Dim v As Variant: v = values.Value2
    Dim sumOfSquaredDifferences As Double
    Dim i As Integer
    '
    ' calculate sum of squared differences between all adjacent values
    For i = 1 To (UBound(v) - 1)
        sumOfSquaredDifferences = sumOfSquaredDifferences + ((v(i + 1, 1) - v(i, 1)) * (v(i + 1, 1) - v(i, 1)))
    Next i
    GetSumOfSquaredDifferences = sumOfSquaredDifferences
End Function
'
Public Function IRSwapLiborPV(ByRef forwards As Excel.Range, ByVal swapRate As Double, _
ByVal yearsToMaturity As Integer, ByVal floatingLegPaymentFrequency As Integer, ByVal notional As Double) As Double
    '
    ' PV (fixed payer swap) = -swapRate * Q(T) + (1 - DF(T))
    ' where Q(T) is sumproduct of fixed leg discount factors and corresponding time accrual factors
    ' assumption : fixed leg is always paid annually
    ' since fixed leg is paid annually and maturity is always integer, time accrual factor will always be exactly 1.0
    Dim f As Variant: f = forwards.Value2
    Dim DF As Double
    Dim Q As Double
    Dim floatingLegTenor As Double: floatingLegTenor = 1 / CDbl(floatingLegPaymentFrequency)
    Dim nextFixedLegCouponDate As Integer: nextFixedLegCouponDate = 1
    Dim currentTimePoint As Double: currentTimePoint = CDbl(0)
    '
    Dim i As Integer
    For i = 1 To (yearsToMaturity * floatingLegPaymentFrequency)
        '
        currentTimePoint = currentTimePoint + floatingLegTenor
        ' first rate is always spot rate, calculate first spot discount factor
        If (i = 1) Then
            DF = 1 / (1 + f(i, 1) * floatingLegTenor)
        End If
        '
        ' other rates are always forward rates
        If (i > 1) Then
            ' solve current spot discount factor using previous spot discount factor
            ' and current forward discount factor : DF(0,2) = DF(0,1) * DF(1,2)
            DF = DF * (1 / (1 + f(i, 1) * floatingLegTenor))
            If ((currentTimePoint - CDbl(nextFixedLegCouponDate)) = 0) Then
                Q = Q + DF
                nextFixedLegCouponDate = nextFixedLegCouponDate + 1
            End If
        End If
    Next i
    IRSwapLiborPV = (-swapRate * Q + (1 - DF)) * notional
End Function
'
'
'
'
'
' Class module : ISolver
Option Explicit
'
' ISolver interface to be implemented
Public Function solve(ByRef parameters As Scripting.Dictionary)
    ' no implementation
End Function
'
'
'
'
'
' Class module : ConstrainedOptimization
Option Explicit
'
Implements ISolver
'
' implementation for ISolver interface
' solver model for constrained optimization tasks
Private Function ISolver_solve(ByRef parameters As Scripting.Dictionary)
    '
    ' reset solver model
    solver.SolverReset
    '
    ' create optimization task
    solver.SolverOk _
        parameters.Item(PRM.objectiveFunction), _
        parameters.Item(PRM.maxMinVal), _
        parameters.Item(PRM.valueOf), _
        parameters.Item(PRM.changingVariables)
    '
    ' add constraints
    solver.SolverAdd _
        parameters(PRM.constraints), _
        parameters(PRM.relation), _
        parameters(PRM.formulaText)
    '
    ' solve optimization model
    solver.SolverOptions AssumeNonNeg:=parameters.Item(PRM.assumeNonNegative)
    solver.SolverSolve parameters.Item(PRM.userFinish)
End Function
'

Sunday, December 14, 2014

Write/read dynamic matrix between Excel and C# with Excel-DNA

This time I wanted to share some quick technical information about how to write or read dynamic matrix between Excel and C# program with Excel-DNA. The scheme what I am presenting here, applies to the case in which we use Excel as input/output platform for some C# program. By saying dynamic matrix, I am referring to the case, in which the dimensions of the input or output matrix are not known at compile time.

To make the long story shorter, you can use the existing program already presented in this blog posting as a base for this new example program. Just replace the content of ExcelInterface.cs file with the information given below.


C# PROGRAM

using System;
using ExcelDna.Integration;
using System.Windows.Forms;
//
namespace ExcelInterface
{
    public static class ExcelInterface
    {
        private static dynamic Excel;
        //
        public static void execute()
        {
            try
            {
                // Create Excel application and random number generator
                Excel = ExcelDnaUtil.Application;
                Random random = new Random(Guid.NewGuid().GetHashCode());
                //
                //
                //
                // CASE 1 : WRITE DYNAMIC MATRIX TO EXCEL
                int rows = (int)Excel.Range("_rows").Value2;
                int cols = (int)Excel.Range("_cols").Value2;
                double[,] matrix = new double[rows, cols];
                //
                // fill matrix with random numbers
                for (int i = 0; i < rows; i++)
                {
                    for (int j = 0; j < cols; j++)
                    {
                        matrix[i, j] = random.NextDouble();
                    }
                }
                // clear old data from output range by using Range.CurrentRegion property
                Excel.Range["_output"].CurrentRegion = "";
                //
                // resize output range to match with the dimensions of newly created random matrix
                Excel.Range["_output"].Resize[rows, cols] = matrix;
                //
                //
                //
                // CASE 2 : READ DYNAMIC MATRIX FROM EXCEL
                object[,] input = (object[,])Excel.Range["_output"].CurrentRegion.Value2;
                rows = input.GetUpperBound(0);
                cols = input.GetUpperBound(1);
                double sum = 0.0;
                //
                // sum all matrix items, calculate average and write it back to Excel
                foreach (object item in input) sum += (double)item;
                Excel.Range["_average"] = (sum / (rows * cols));
            }
            catch (Exception e)
            {
                MessageBox.Show(e.Message.ToString());
            }
        }
    }
}


In a nutshell, after creating ExcelDnaUtil.Application, we are able to use some extremely useful properties for manipulating Excel.Range object, such as CurrentRegion, Offset and Resize.

EXCEL WORKSHEET SETUPS


Dimensions for dynamic matrix output are given by the user in cells F4 and F5. Output matrix is printed to cell B8 (top left cell of output matrix). Input matrix is the same as output matrix and the C#-processed output (arithmetic average of all input matrix values) is printed into cell F6.


We have to set a couple of named Excel ranges for C# program. All the needed four named ranges are given in the screenshot below.


After implementing these range names, create a new button (Forms Controls) to this worksheet and put our C# program name into Macro box (execute). By doing this, we can get rid of the VBA code (Application.Run) completely. Any public static void method in our .NET code will be registered by Excel-DNA as a macro in Excel. Thanks for this tip to Govert Van Drimmelen (the inventor and author of Excel-DNA). After implementing all these steps, we are ready to use the program.

The purpose of this posting was to show how to handle dynamic data IO to/from Excel in C# program with Excel-DNA. For learning more things about Excel-DNA, check out its homepage. Getting more information and examples with your problems, the main source is Excel-DNA google group. Excel-DNA is an open-source project, and we (the happy users) can invest its future development by making a donation.

Thanks for reading my blog and happy waiting until Christmas.

-Mike

Saturday, August 16, 2014

Bootstrapping OIS-adjusted Libor curve in VBA

OIS discounting has been hot topic for the last few years, since most of the collateralized OTC swaps are valued by this methodology. In this blog post, I will present simple example algorithm for bootstrapping OIS-adjusted Libor curve from market data (OIS zero-coupon curve, Libor par swap curve). This bootstrapped curve can then be used to generate floating leg cash flows, when valuing collateralized interest rate swap with all cash flows and collateral in the same currency. Final product will be just one simple VBA worksheet function to be used in Excel.

VALUATION 101

In essence
  • Instead of using Libor zero-coupon curve for cash flow discounting, all swap cash flows are present valued with discount factors calculated by using OIS zero-coupon curve. 
  • The use of OIS zero-coupon curve for discounting collateralized swap cash flows is justified, because posted collateral earns overnight rate and collateral value is mark-to-market value of a swap. In order to equate these two cash flows (collateral value, mark-to-market value of a swap), discount factor for both cash flows has to be calculated by using OIS curve.
  • Cash flows for swap fixed leg are still constructed by using ordinary Libor par swap rates. 
  • Another impact of OIS valuation hits into construction of floating leg coupon rates, which are technically forward rates.
  • In the "old world", we bootstrapped Libor zero-coupon curve, from which we calculated discount factors and forward rates (for constructing floating leg coupons) at the same time. Only one curve was needed to accomplish this procedure. 
  • Because all swap cash flows are now discounted with OIS zero-coupon curve and ordinary Libor par swap rates are still used for constructing swap fixed leg cash flows, forward rates have to be "adjusted" slightly, in order to equate present value of all swap cash flows to be zero.
  • Technically, we end up with a system of linear equations, in which we equate OIS-discounted floating cash flows with OIS-discounted fixed cash flows and solve for the unknown forward rates.
Material, which has helped me to understand this subject a bit better is the following: technical notes written by Justin Clarke, teaching material by Donald J. Smith and Barclays research paper by Amrut Nashikkar. These papers have worked numerical examples, as well as theoretical issues covered thoroughly.

VBA FUNCTION


Option Explicit
'
Public Function OIS_bootstrapping(ByRef curves As Range) As Variant
    '
    ' import source data from Excel range into matrix
    Dim source As Variant: source = curves.Value2
    '
    ' create all the needed matrices and define dimensions
    Dim nSwaps As Integer: nSwaps = UBound(source, 1)
    Dim fixed As Variant: ReDim fixed(1 To nSwaps, 1 To 1)
    Dim float As Variant: ReDim float(1 To nSwaps, 1 To nSwaps)
    Dim forward As Variant: ReDim forward(1 To nSwaps, 1 To 1)
    '
    ' counters and other temp variables
    Dim i As Integer, j As Integer, k As Integer, nCashFlows As Integer
    Dim OIS_DF As Double, OIS_Rate As Double, t As Double
    '
    ' loop for cash flows processing
    nCashFlows = nSwaps: k = 0
    For i = 1 To nSwaps
        '
        ' create OIS discount factor
        OIS_Rate = source(i, 2): t = source(i, 1)
        If (t <= 1) Then OIS_DF = 1 / (1 + (OIS_Rate * t))
        If (t > 1) Then OIS_DF = 1 / (1 + OIS_Rate) ^ t
        '
        ' create sum of fixed leg pv's for each individual swap and create all
        ' cash flows (excluding coupon rate) for floating legs for each individual swap
        For j = 1 To nSwaps
            If (j <= nCashFlows) Then
                fixed(j + k, 1) = fixed(j + k, 1) + 100 * source(j + k, 3) * OIS_DF
                float(i, j + k) = 100 * OIS_DF
            Else
                ' replace empty array value with zero value
                float(i, nSwaps - j + 1) = 0#
            End If
        Next j
        '
        k = k + 1: nCashFlows = nCashFlows - 1
    Next i
    '
    ' solve for implied forward rates, which are going to be used to generate coupons
    ' for floating legs. matrix operation: [A * x = b] ---> [x = Inverse(A) * b]
    ' where A = float (N x N), x = forward rates (N x 1), b = sum of swap fixed leg pv's (N x 1)
    forward = WorksheetFunction.MMult(WorksheetFunction.MInverse(WorksheetFunction.transpose(float)), fixed)
    OIS_bootstrapping = forward
End Function
'


EXAMPLE CALCULATION


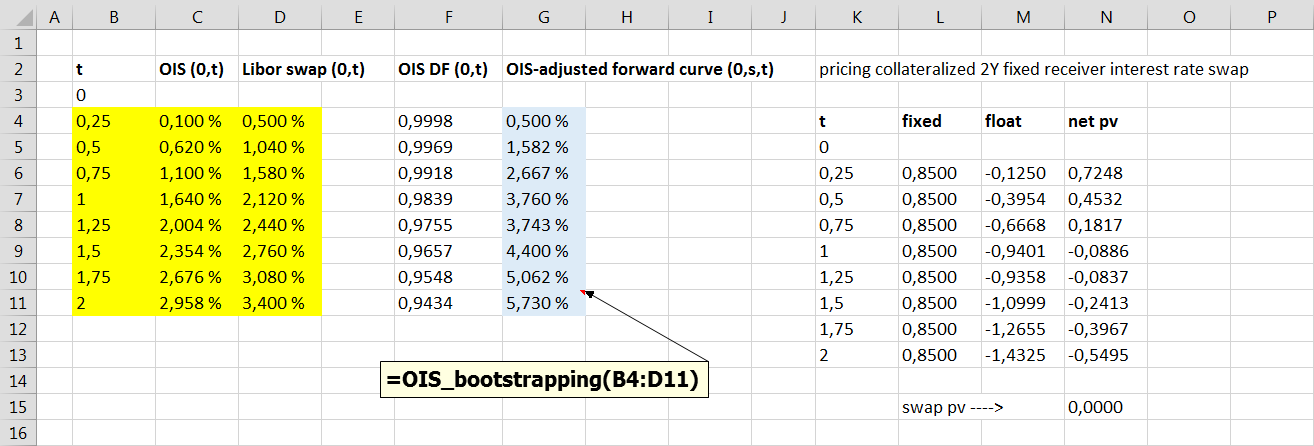
The following Excel screenshot presents bootstrapped OIS-adjusted forward curve (column G) and OIS valuation for collateralized 2Y interest rate swap. For the sake of simplicity, this example assumes that the payments for the both fixed and floating legs takes place quarterly. Swap fixed cash flows has been constructed by using Libor par swap rates. Floating leg cash flows has been constructed by using bootstrapped OIS-adjusted forward curve. Finally, all cash flows are discounted by using OIS discount factors (column F). The present value of all swap cash flows is zero. Worksheet function input range has been marked with yellow color and function output range has been marked with blue color.


Presented forward curve construction scheme applies to a specific case, in which collateralized interest rate swap has the both cash flow legs and collateral in the same currency. Moreover, it is assumed that the payment frequency is the same for the both swap legs. Successful replication of the forward curve bootstrapping result was achieved, when testing VBA worksheet function with the cases presented in above-mentioned papers by Smith and Clarke.

Thanks for reading.

-Mike