IMPLIED SURVIVAL PROBABILITY
Calculating implied survival probabilities from CDS prices follows the same idea, as calculating implied volatility from option price. For options, we have known market price, from which we can numerically solve the corresponding option volatility by using option pricing model. For CDS, we have known market price, from which we can solve the corresponding survival probability by using CDS pricing model. This is exactly the procedure, what this algorithm is doing. However, instead of just calculating one survival probability for a given CDS price, the algorithm is calculating all survival probabilities for a given CDS term structure. The pricing model for CDS is standard model (JP Morgan approach).Update (9.11.2016) : This presented implementation (using simple JP Morgan CDS model) ignores the effect of premium leg accruals. The resulting bias is relatively insignificant for low CDS levels but becomes material with high CDS levels. The issue has been chewed in the paper published by Lehman Brothers Fixed Income Quantitative Credit Research (Dominic O'Kane, Stuart Turnbull). On chapter 5, there is a discussion concerning premium leg valuation and related accrual effects. There is also a suggestion available for including premium accrual into this CDS pricing model. Thanks for attentive blog visitor for outlining this issue.
FUNCTION INPUT/OUTPUT
Zero-coupon bond prices, CDS prices and recovery rate assumption are needed as market data input for calculations. VBA function survivalProbability takes market information matrix (curves) and recovery rate assumption value (recovery) as input parameters. Function then returns an array of survival probabilities. Default probabilities can then be calculated from survival probabilities.Input market information matrix (N x 3) should contain the following data in the following order:
- 1st row vector - maturities in years
- 2nd row vector - zero-coupon bond prices (ex. 0.9825)
- 3rd row vector - CDS prices as basis points (ex. 0.25 % is given as 25)
After giving required input parameters for this function and selecting correct range for function output, remember to press CTRL+SHIFT+ENTER for retrieving result array (N x 1) into worksheet.
VBA FUNCTION
Option Explicit
'
' function takes market curves matrix (Nx3) and recovery rate (1x1) as arguments, then calculates and
' returns vector of survival probabilities (Nx1) for a given market data
' matrix input data order: 1st row vector = time, 2nd row vector = zero-coupon bond prices,
' 3rd row vector = cds rates in basis points
Public Function survivalProbability(ByRef curves As Range, ByVal recovery As Double) As Variant
    '
    ' information for dimensioning arrays
    Dim nColumns As Integer: nColumns = curves.Columns.Count
    Dim nRows As Integer: nRows = curves.Rows.Count
    '
    ' create arrays for data
    Dim p() As Double: ReDim p(0 To nRows)
    Dim c() As Double: ReDim c(0 To curves.Rows.Count, 1 To curves.Columns.Count)
    '
    ' copy variant array data into new array, having 1 additional item for today
    c(0, 1) = 0: c(0, 2) = 1: c(0, 3) = 0
    Dim cInput As Variant: cInput = curves.Value2
    '
    Dim i As Integer, j As Integer, k As Integer
    For i = 1 To nRows
        c(i, 1) = cInput(i, 1)
        c(i, 2) = cInput(i, 2)
        c(i, 3) = cInput(i, 3)
    Next i
    '
    ' calculation of survival probabilities (SP)
    Dim L As Double: L = (1 - recovery)
    Dim term As Double, terms As Double, divider As Double, term1 As Double, term2 As Double
    '
    For i = LBound(p) To UBound(p)
        '
        If (i = 0) Then p(i) = 1# ' SP today is one
        If (i = 1) Then p(i) = L / ((c(i, 3) / 10000) * (c(i, 1) - c(i - 1, 1)) + L) ' first SP formula
        '
        If (i > 1) Then ' SP after first period are calculated recursively
            terms = 0
            For j = 1 To (i - 1)
                term = c(j, 2) * (L * p(j - 1) - (L + (c(j, 1) - c(j - 1, 1)) * (c(i, 3) / 10000)) * p(j))
                terms = terms + term
            Next j
            '
            divider = c(i, 2) * (L + (c(i, 1) - c(i - 1, 1)) * (c(i, 3) / 10000))
            term1 = terms / divider
            term2 = (p(i - 1) * L) / (L + (c(i, 1) - c(i - 1, 1)) * (c(i, 3) / 10000))
            p(i) = term1 + term2
        End If
    Next i
    '
    ' create output array excluding the first SP (for today)
    Dim result() As Double: ReDim result(1 To UBound(p))
    For i = 1 To UBound(p)
        result(i) = p(i)
    Next i
    '
    ' finally, transpose output array (Nx1)
    survivalProbability = Application.WorksheetFunction.Transpose(result)
End Function
'
CALCULATION EXAMPLE
The following Excel screenshot presents the calculation of default probabilities for Barclays and HSBC. Market data has been retrieved in early january 2014. VBA function input matrix (curves) has been marked with yellow color. Function output range has been marked with blue color. Default probability (PD) is calculated in column G.
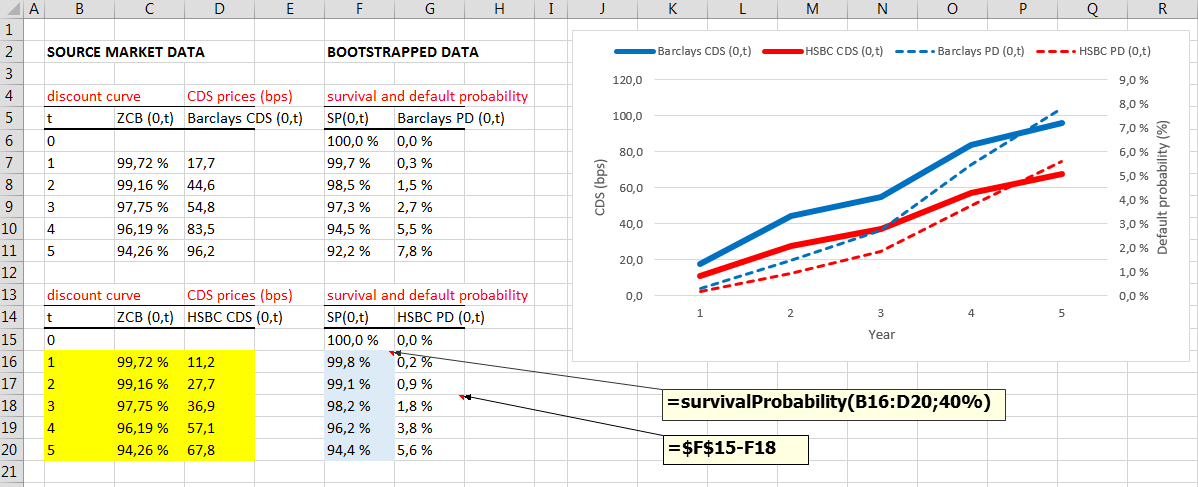
Thanks for reading.
-Mike