Saturday, August 16, 2014

Bootstrapping OIS-adjusted Libor curve in VBA

OIS discounting has been hot topic for the last few years, since most of the collateralized OTC swaps are valued by this methodology. In this blog post, I will present simple example algorithm for bootstrapping OIS-adjusted Libor curve from market data (OIS zero-coupon curve, Libor par swap curve). This bootstrapped curve can then be used to generate floating leg cash flows, when valuing collateralized interest rate swap with all cash flows and collateral in the same currency. Final product will be just one simple VBA worksheet function to be used in Excel.

VALUATION 101

In essence
  • Instead of using Libor zero-coupon curve for cash flow discounting, all swap cash flows are present valued with discount factors calculated by using OIS zero-coupon curve. 
  • The use of OIS zero-coupon curve for discounting collateralized swap cash flows is justified, because posted collateral earns overnight rate and collateral value is mark-to-market value of a swap. In order to equate these two cash flows (collateral value, mark-to-market value of a swap), discount factor for both cash flows has to be calculated by using OIS curve.
  • Cash flows for swap fixed leg are still constructed by using ordinary Libor par swap rates. 
  • Another impact of OIS valuation hits into construction of floating leg coupon rates, which are technically forward rates.
  • In the "old world", we bootstrapped Libor zero-coupon curve, from which we calculated discount factors and forward rates (for constructing floating leg coupons) at the same time. Only one curve was needed to accomplish this procedure. 
  • Because all swap cash flows are now discounted with OIS zero-coupon curve and ordinary Libor par swap rates are still used for constructing swap fixed leg cash flows, forward rates have to be "adjusted" slightly, in order to equate present value of all swap cash flows to be zero.
  • Technically, we end up with a system of linear equations, in which we equate OIS-discounted floating cash flows with OIS-discounted fixed cash flows and solve for the unknown forward rates.
Material, which has helped me to understand this subject a bit better is the following: technical notes written by Justin Clarke, teaching material by Donald J. Smith and Barclays research paper by Amrut Nashikkar. These papers have worked numerical examples, as well as theoretical issues covered thoroughly.

VBA FUNCTION


Option Explicit
'
Public Function OIS_bootstrapping(ByRef curves As Range) As Variant
    '
    ' import source data from Excel range into matrix
    Dim source As Variant: source = curves.Value2
    '
    ' create all the needed matrices and define dimensions
    Dim nSwaps As Integer: nSwaps = UBound(source, 1)
    Dim fixed As Variant: ReDim fixed(1 To nSwaps, 1 To 1)
    Dim float As Variant: ReDim float(1 To nSwaps, 1 To nSwaps)
    Dim forward As Variant: ReDim forward(1 To nSwaps, 1 To 1)
    '
    ' counters and other temp variables
    Dim i As Integer, j As Integer, k As Integer, nCashFlows As Integer
    Dim OIS_DF As Double, OIS_Rate As Double, t As Double
    '
    ' loop for cash flows processing
    nCashFlows = nSwaps: k = 0
    For i = 1 To nSwaps
        '
        ' create OIS discount factor
        OIS_Rate = source(i, 2): t = source(i, 1)
        If (t <= 1) Then OIS_DF = 1 / (1 + (OIS_Rate * t))
        If (t > 1) Then OIS_DF = 1 / (1 + OIS_Rate) ^ t
        '
        ' create sum of fixed leg pv's for each individual swap and create all
        ' cash flows (excluding coupon rate) for floating legs for each individual swap
        For j = 1 To nSwaps
            If (j <= nCashFlows) Then
                fixed(j + k, 1) = fixed(j + k, 1) + 100 * source(j + k, 3) * OIS_DF
                float(i, j + k) = 100 * OIS_DF
            Else
                ' replace empty array value with zero value
                float(i, nSwaps - j + 1) = 0#
            End If
        Next j
        '
        k = k + 1: nCashFlows = nCashFlows - 1
    Next i
    '
    ' solve for implied forward rates, which are going to be used to generate coupons
    ' for floating legs. matrix operation: [A * x = b] ---> [x = Inverse(A) * b]
    ' where A = float (N x N), x = forward rates (N x 1), b = sum of swap fixed leg pv's (N x 1)
    forward = WorksheetFunction.MMult(WorksheetFunction.MInverse(WorksheetFunction.transpose(float)), fixed)
    OIS_bootstrapping = forward
End Function
'


EXAMPLE CALCULATION


The following Excel screenshot presents bootstrapped OIS-adjusted forward curve (column G) and OIS valuation for collateralized 2Y interest rate swap. For the sake of simplicity, this example assumes that the payments for the both fixed and floating legs takes place quarterly. Swap fixed cash flows has been constructed by using Libor par swap rates. Floating leg cash flows has been constructed by using bootstrapped OIS-adjusted forward curve. Finally, all cash flows are discounted by using OIS discount factors (column F). The present value of all swap cash flows is zero. Worksheet function input range has been marked with yellow color and function output range has been marked with blue color.


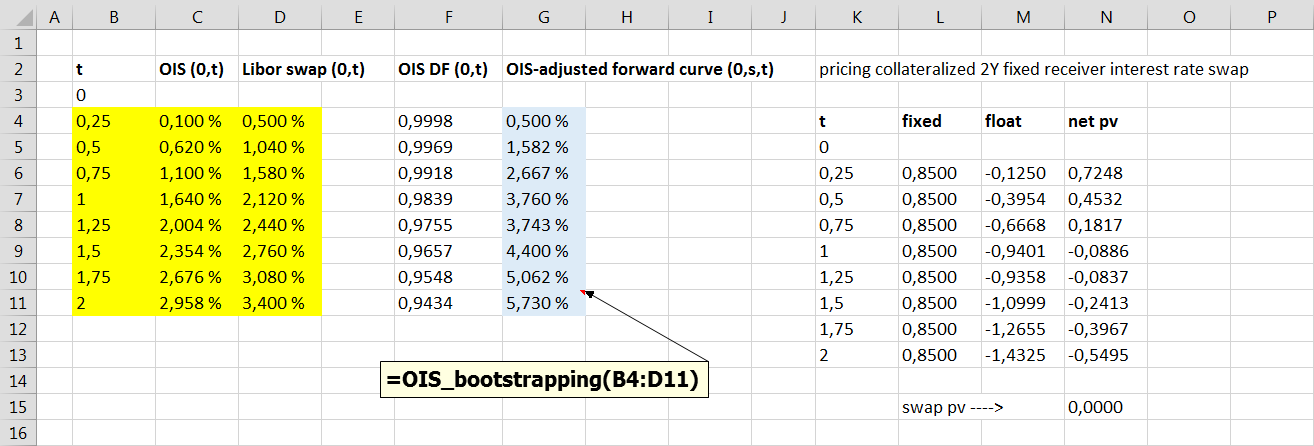
Presented forward curve construction scheme applies to a specific case, in which collateralized interest rate swap has the both cash flow legs and collateral in the same currency. Moreover, it is assumed that the payment frequency is the same for the both swap legs. Successful replication of the forward curve bootstrapping result was achieved, when testing VBA worksheet function with the cases presented in above-mentioned papers by Smith and Clarke.

Thanks for reading.

-Mike

Friday, August 15, 2014

Bootstrapping default probabilities from CDS prices in VBA

Default probabilities are needed when dealing with credit market models. This time, I wanted to present one simple algorithm for bootstrapping default probabilities from CDS market prices. Final product will be just one simple Excel/VBA worksheetfunction, which can be quickly copy-pasted and used in VBE standard module.


IMPLIED SURVIVAL PROBABILITY

Calculating implied survival probabilities from CDS prices follows the same idea, as calculating implied volatility from option price. For options, we have known market price, from which we can numerically solve the corresponding option volatility by using option pricing model. For CDS, we have known market price, from which we can solve the corresponding survival probability by using CDS pricing model. This is exactly the procedure, what this algorithm is doing. However, instead of just calculating one survival probability for a given CDS price, the algorithm is calculating all survival probabilities for a given CDS term structure. The pricing model for CDS is standard model (JP Morgan approach).

Update (9.11.2016) : This presented implementation (using simple JP Morgan CDS model) ignores the effect of premium leg accruals. The resulting bias is relatively insignificant for low CDS levels but becomes material with high CDS levels. The issue has been chewed in the paper published by Lehman Brothers Fixed Income Quantitative Credit Research (Dominic O'Kane, Stuart Turnbull). On chapter 5, there is a discussion concerning premium leg valuation and related accrual effects. There is also a suggestion available for including premium accrual into this CDS pricing model. Thanks for attentive blog visitor for outlining this issue.


FUNCTION INPUT/OUTPUT

Zero-coupon bond prices, CDS prices and recovery rate assumption are needed as market data input for calculations. VBA function survivalProbability takes market information matrix (curves) and recovery rate assumption value (recovery) as input parameters. Function then returns an array of survival probabilities. Default probabilities can then be calculated from survival probabilities.

Input market information matrix (N x 3) should contain the following data in the following order:
  • 1st row vector - maturities in years
  • 2nd row vector - zero-coupon bond prices (ex. 0.9825)
  • 3rd row vector - CDS prices as basis points (ex. 0.25 % is given as 25)

After giving required input parameters for this function and selecting correct range for function output, remember to press CTRL+SHIFT+ENTER for retrieving result array (N x 1) into worksheet.


VBA FUNCTION


Option Explicit
'
' function takes market curves matrix (Nx3) and recovery rate (1x1) as arguments, then calculates and
' returns vector of survival probabilities (Nx1) for a given market data
' matrix input data order: 1st row vector = time, 2nd row vector = zero-coupon bond prices,
' 3rd row vector = cds rates in basis points
Public Function survivalProbability(ByRef curves As Range, ByVal recovery As Double) As Variant
    '
    ' information for dimensioning arrays
    Dim nColumns As Integer: nColumns = curves.Columns.Count
    Dim nRows As Integer: nRows = curves.Rows.Count
    '
    ' create arrays for data
    Dim p() As Double: ReDim p(0 To nRows)
    Dim c() As Double: ReDim c(0 To curves.Rows.Count, 1 To curves.Columns.Count)
    '
    ' copy variant array data into new array, having 1 additional item for today
    c(0, 1) = 0: c(0, 2) = 1: c(0, 3) = 0
    Dim cInput As Variant: cInput = curves.Value2
    '
    Dim i As Integer, j As Integer, k As Integer
    For i = 1 To nRows
        c(i, 1) = cInput(i, 1)
        c(i, 2) = cInput(i, 2)
        c(i, 3) = cInput(i, 3)
    Next i
    '
    ' calculation of survival probabilities (SP)
    Dim L As Double: L = (1 - recovery)
    Dim term As Double, terms As Double, divider As Double, term1 As Double, term2 As Double
    '
    For i = LBound(p) To UBound(p)
        '
        If (i = 0) Then p(i) = 1# ' SP today is one
        If (i = 1) Then p(i) = L / ((c(i, 3) / 10000) * (c(i, 1) - c(i - 1, 1)) + L) ' first SP formula
        '
        If (i > 1) Then ' SP after first period are calculated recursively
            terms = 0
            For j = 1 To (i - 1)
                term = c(j, 2) * (L * p(j - 1) - (L + (c(j, 1) - c(j - 1, 1)) * (c(i, 3) / 10000)) * p(j))
                terms = terms + term
            Next j
            '
            divider = c(i, 2) * (L + (c(i, 1) - c(i - 1, 1)) * (c(i, 3) / 10000))
            term1 = terms / divider
            term2 = (p(i - 1) * L) / (L + (c(i, 1) - c(i - 1, 1)) * (c(i, 3) / 10000))
            p(i) = term1 + term2
        End If
    Next i
    '
    ' create output array excluding the first SP (for today)
    Dim result() As Double: ReDim result(1 To UBound(p))
    For i = 1 To UBound(p)
        result(i) = p(i)
    Next i
    '
    ' finally, transpose output array (Nx1)
    survivalProbability = Application.WorksheetFunction.Transpose(result)
End Function
'


CALCULATION EXAMPLE


The following Excel screenshot presents the calculation of default probabilities for Barclays and HSBC. Market data has been retrieved in early january 2014. VBA function input matrix (curves) has been marked with yellow color. Function output range has been marked with blue color. Default probability (PD) is calculated in column G.


Thanks for reading.

-Mike